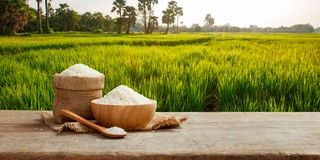
South Korea donated rice to the Republic of Kenya.
South Korea this month donated rice to the Republic of Kenya. With thumbs straight up, South Korea’s Agriculture Minister Song Miryung gave hints on how the rice had come about.
Korea was the only country to transform from the shackles of donor dependency to become a donor in 50 years.
With independent Kenya at over 50, the Director-General of the Food and Agriculture Organization (FAO), no less, has expounded the centrality of Africa in global food security: Africa holds the key to moving towards a world free from hunger and poverty.
Yet, the gifting of rice to Kenya and Miryung’s remark reveal little of the lost ground on food security in the country, or the lack of support to the sector.
Food insecurity in Kenya climbed from 15 per cent between 2014 to 2016 to 28 per cent from 2020 to 2022. The thumbs up fool no one tracing recent scandals depicting a Kenyan government caught like a rabbit in the headlights, wrecking agriculture sector with fake fertiliser.
The line minister comes from Meru County, the top achiever in food security in Kenya during the 2018-2022 period at a contribution of 7.6 per cent of national agriculture output. Yet, Meru struggles even in that sector.
This article looks at the 10 counties of the Central Region Economic Bloc (Cereb) the difficulties of agriculture and why lopsided devolution allocation of resources could be contributing regional and national failures.
It is a striking portrayal of how hard facts in agriculture are ignored by ‘Bottom Up’ theorists living in glass houses and throwing stone-laden fertiliser at hardworking farmers.
Likewise, the evidence from the grassroots is an indictment of how clueless politicians often overlook evidence, duping and prophesying how they’ll turn their counties into climate changers, greening champions, and food-baskets of Kenya, giving pride of place to handouts like rice from Korea.
During September 2023 to March 2024, I had the good fortune to lead a ring-side team crisscrossing the Cereb bloc of 10 counties to prepare an economic blueprint.
Evidence and data from respected sources came in handy for measurements of the economic evolution of counties sometimes yielding facts often obfuscated by clueless politicians. Guess what? Support with fiscal resources to drive county economies and regain food security have long simulated the fertiliser scandal.
The allocation of fiscal spending to the counties goes in the opposite direction of county efforts and performance at their Gross Domestic Product (GDP) contributions to Kenya, including their contributions to food security in agriculture sector output.
Using information from the Kenya National Bureau of Statistics (Gross County Report, latest 2023), regular reports of the Office of the Controller of Budget, and Commission for Revenue allocation data, one can easily draw a picture of the structure of Kenya’s economic blocs their performances, then dissect the key sector for food security, agriculture- which is the mainstay of over 70 per cent of Kenya African households.
The 10 Cereb counties constitute Kenya’s leading economic bloc, contributing over 26 per cent to the GDP annually, averaged over 2013-2020 according to the Kenya National Bureau of Statistics (KNBS) GCP Report, 2023. Nairobi County and the Lake Region Economic Bloc (with 14 counties) account for 22 per cent and 20 per cent, respectively.
Outside of the Cereb, ‘Cerebic’ economic activity proliferates in Nairobi County and significant business investments and economic activity originating in the bloc are significant in other counties.
From the 2018-2022 KNBS GCP report measuring the economic evolution of counties, the top five counties contributing to Kenya’s average output featured three Cereb counties: Kiambu (5.7 per cent), Nakuru (4.9 per cent) and Meru (3.3 per cent). The relevant sector for food security, agriculture, is highly significant in Cereb which accounts for 33 per cent of Gross Domestic Product (GDP).
While agriculture nationally employs more than 40 per cent of the total population and 70 per cent of the rural population, in national agriculture effort, Cereb Gross Value Added (GVA, meaning output) features the top five counties contributing to Kenya’s main performance (on averages) in the 2018-2022 period – KNBS GCP Report 2023 – which cites the Counties and their national contributions as Meru (7.6 per cent), Nakuru (5.2 per cent), Nyandarua (4.5 per cent), Murang’a (4.2 per cent), and Kiambu (4 per cent).
The five Cereb leading counties alone contributed 25.4 per cent of Kenya’s national agriculture sector performance.
The 10 Cereb counties collectively spearheaded Kenya’s food security, contributing about 35 per cent (with a county average of 3.3 per cent over 2018-2022) constituting the foremost anchor in sector performance and food security. Cereb is thus the food basket of Kenya.
At individual commodity level, especially commodities that matter to Kenya’s agricultural export performance, value-chain development, and required reforms such as in coffee, a set of Cereb counties are Kenya’s leading producers.
Kiambu is the largest grower of coffee in Kenya where growing acreage competes with an expanding and better-earning real estate sector.
It had 20,369 hectares of land under coffee by June 2022, according to data from the Ministry of Agriculture. This is more than double the size of land under coffee bushes in its closest competitor, Kirinyaga County, with 10,089 hectares.
Nyeri, Murang’a, and Meru close out the top Kenya five growers with 9,841 hectares, 9,413 hectares, and 8,708.4 hectares under coffee, respectively. In the year to June 2022, Kiambu produced 10.63 million kilograms of cherries followed by Kirinyaga (8.77 million kilograms) and Nyeri (6.82 million kilograms).
Other top growers in Kenya are Machakos (8,013 hectares), Bungoma (7,725 hectares), Embu (6,881 hectares), Kericho (4,842 hectares) and Kisii (4,579 hectares).
For comparisons, the 10-county Cereb agriculture performance compares with the 33 per cent share contributed by a combined 29 counties (with county average of 1.1 per cent) produced by the lowest contributors to agriculture GVA in Kenya’s GDP.
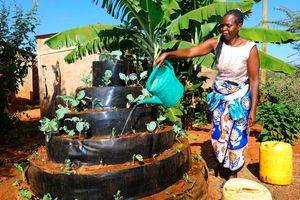
Yet, the impressions and barriers everywhere in Cereb indicate that the region is beset by poor access to inputs such as subsidised fertiliser, and discriminatory taxation in agriculture – such as avocadoes that raised tensions recently.
The latter disparity is the victim and example of mangled and selective taxation focusing Cereb subsectors of agriculture, while other sub-sector products in widespread national production, such as livestock and fisher-ies escape the revenue effort.
In contrast to the above, Kenya’s extremely lopsided revenue allocation formulas under devolution for the last 10 years – 2013-2022 – comparing fiscal spending, reflect a makeshift scramble for revenues with negative growth and development results for the beneficiary counties in allocations, and Cereb counties, and the Kenyan economy as a whole.
The disparities became real in the past decade. The devolution framework saw a decline in Cereb’s growth momentum over 2014-2022. The latest available data on spending allocations to 47 counties - the third quarter, 2023 report of the Controller of Budget – shows a patchwork quilt, where Cereb counties routinely are trapped in low officially allocated spending compared to their efforts in generating Kenya’s GDP.
In the structural disparities from production to fiscal spending allocations, the highest fiscal spending per capita was in Lamu County, at Sh21,026 per person, while Lamu contributes 0.3 per cent of Kenya’s GDP on average.
In contrast, Cereb’s 10 counties that contributed an average of 2.39 per cent to Kenya GDP per county, over 2013-2020 (in constant 2016 prices) received disproportionately low allocations. As example from Fig 1, Kiambu County, contributing 6 per cent of Kenya GDP on average, received a measly, impoverishing Sh4, 472 per person, nearly five times lower than the allocation to Lamu of Sh21,026 per person.
The disparities allow some counties favored by revenue allocations for spending to enjoy better fiscal endowments than others. The tragic reality is that the allocations are being pocketed in corruption and poor governance.
Ahmesiad Mohamed (DN April 18, 2024) provides a helicopter view of how decentralisation and the dream of Devolution to apply equalisation funding to scale up development has been destroyed in the last decade.
Allocated spending is littered with mismanagement, patronage that squashes competences, and opaque spending.
Allocated funds are applied not to pressing County activities but to cutthroat indulgent usages where positive development impacts are hard to trace, even for the Auditor General.
Delivery of basic services has failed widely with delivery regressing notably in agriculture, education, and health. COB untiringly flags alarming financial reporting (or lack of it) or the fault-lines or forays by county political leaders in spending. That’s my beef with Korea’s rice.