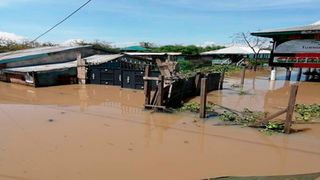
Flooded eateries in Dunga Beach in Kisumu on May 20, 2020.
| Tonny Omondi | Nation Media GroupNews
Premium
Key global climate trends data for the past five decades

The earth has undergone many shifts in cooling and warming, driven by natural factors such as the sun’s energy and variations in its orbit in previous centuries. However, human activities in the second and third industrial revolutions have contributed more than 95 per cent of climatic changes, resulting in a dreadful trend in the past 50 years.
So, how can we ascertain that our climate is changing permanently, rather than temporarily? The Nation looks at key data points of seven major changes that scientists have identified in the global climate system from 1970 to 2020.

A man gives a bath to his son with a water tube well near a field as the temperature rises in New Delhi on June 10, 2020.


1. Rising land temperatures
The planet’s average surface temperature has risen about 1.18 degrees Celsius since the late 19th century, a change driven largely by increased carbon dioxide emissions into the atmosphere and human activities.
However, most of the warming began in 1970, with the seven most recent years being the warmest, rising from an increase of 0.1 degrees in 1970 to an increase of 0.98 degrees in 2020.
According to scientists at NASA’s Goddard Institute for Space Studies (GISS), 2016 and 2020 have been the warmest years on record.
“The previous record warm year, 2016, received a significant boost from a strong El Niño. The lack of a similar assist from El Niño in 2021 is evidence that the background climate continues to warm due to greenhouse gases,” says GISS director Gavin Schmidt.
According to the United States National Oceanic and Atmospheric Administration (NOAA), in 2020, the global land surface temperature increased by 0.98°C. This value is only 0.02°C shy of tying the record high value of +1.00°C set in 2016.
The decadal global land-surface average temperature anomaly for 2011–2020 was the warmest decade on record for the globe, with a surface global temperature of +0.82°C above the 20th-century average.
The lowest layer of the atmosphere, called the troposphere, where we live, is warming, from an anomaly of -0.2 degrees in 1970 to 0.4 degrees in 2020. Consequently, greenhouse gases build up and trap heat that radiates from the earth’s surface.
As a result, the frequency and severity of droughts and heatwaves are increasing. Intense droughts have led to destructive wildfires in Australia, Portugal and the US. In Africa, crops have failed and low water supplies have been experienced.

Salabani village where the rising water levels of Lake Baringo have now flooded displacing entire villages near Marigat, Baringo County on October 6, 2020.
2. Increasing ocean air temperatures
Data from NOAA shows that the average global sea surface temperature – the temperature of the upper few metres of the ocean – has increased by approximately 0.13°C per decade over the past 100 years
From an increase of 0.05 degrees in 1970 to a rise of 0.6 degrees in 2010, ocean temperatures rose even higher in the last decade. Averaged as a whole, the global ocean surface temperature for March 2020 was 1.16°C above the 20th century average of 12.7°C.
The ocean has absorbed much of this increased heat, with the top 100 metres of ocean showing warming of more than 0.33 degrees Celsius since 1970, according to data published by the Climate Reality Project. Earth stores 90 per cent of its extra energy in the ocean.
Roughly, 70 per cent of the world is covered by oceans, so you can understand how hotter air over them could make a vast difference in the climate system. Oceans evaporate more water as the air right near the surface gets warmer. The result? More floods, more hurricanes, and more extreme precipitation events.

An iceberg is locked in sea ice as seen from NASA's Operation IceBridge research aircraft along the Upper Baffin Bay coast on March 27, 2017 above Greenland.
3. Shrinking ice sheets
The Greenland and Antarctic ice sheets have decreased in mass. Data from NASA’s Gravity Recovery and Climate Experiment show Greenland lost an average of 279 billion metric tonnes of ice per year between 1993 and 2019, while Antarctica lost about 148 billion metric tonnes of ice per year.
Hadley Centre Sea Ice and Sea Surface Temperature data shows that Arctic ice sheets reduced from eight million square kilometres in 1970 to less than four million square kilometres in 2020.
Satellites show areas covered by snow in the Northern Hemisphere are becoming smaller. Snow is important as it helps control how much of the sun’s energy the earth absorbs. Light-coloured snow and ice reflect this energy into space, helping keep the planet cool.
However, as the snow and ice melt, it’s replaced by dark land and ocean, both of which absorb energy. The amount of snow and ice loss in the last 30 years is higher than many scientists predicted, which means the earth is absorbing more solar energy than had been projected.
The Arctic ice cap shrinks each summer when days are longer, reaching its lowest point of the year in September.
Scientists warn that the Arctic could lose almost all of its summer ice cover by 2100 or melt completely much sooner than that.

Glacier melting on the East Coast, Greenland.
4. Melting glaciers
Glaciers are vanishing at an alarming rate, a clear sign of climate change. In a world unaffected by climate change, glacier mass stays balanced, meaning the ice that evaporates in the summer is fully replaced by snowfall in the winter.
However, when more ice melts than is replaced, the glacier loses mass. And the people who depend on melting ice for water to support their farming and living needs are deeply affected.
Glaciers are retreating almost everywhere around the world — including in the Alps, Himalayas, Andes, Rockies, Alaska, and Africa.
Satellite observations reveal that the amount of spring snow cover in the Northern Hemisphere has decreased over the past five decades and the snow is melting earlier.
According to Climate Reality Project, the average mass balance in 1970 was -150 but deteriorated to less than -800 in 2005, with statistics from the World Glacier Monitoring Service revealing that it hit -1200 around 2007.

This photograph taken on August 27, 2018, on the beach in Vridi, the industrial neighbourhood of Abidjan, shows the ruins of a hotel which was destroyed by the rise in sea levels.
5. Sea levels on the rise
Global sea level rose about 20 centimetres in the last century.
The rate in the last two decades, however, is nearly double that of the last century and accelerating slightly every year. Data from NOAA indicates that the average sea level in 1970 had risen by 11 centimetres but it has soared by 21 centimetres 50 years later on average.
With the current rate of sea-level rise, populations living in coastal areas are in great danger if storms intensify and more extreme flooding occurs. Eight of the 10 largest cities in the world are near a coast.
Marine life is threatened as salt water intrudes into freshwater aquifers, many of which support human communities and natural ecosystems.

People take photos on a tour boat as steam plumes rise while lava enters the Pacific Ocean, after flowing to the water from a Kilauea volcano fissure, on Hawaii's Big Island on May 20, 2018 near Pahoa, Hawaii. Officials are concerned that 'laze', a dangerous product produced when hot lava hits cool ocean water, will affect residents. Laze, a word combination of lava and haze, contains hydrochloric acid steam along with volcanic glass particles.
6. Rising ocean acidity
Since the beginning of the Industrial Revolution, the acidity of surface ocean waters has increased by about 30 per cent. The ocean has absorbed between 20 per cent and 30 per cent of total anthropogenic carbon dioxide emissions in recent decades, according to NOAA. This increase is the result of humans emitting more carbon dioxide into the atmosphere and hence more being absorbed into the ocean.
In the ocean, carbon dioxide reacts with seawater to form carbonic acid. This causes the acidity of seawater to increase. The ocean’s average pH is now around 8.1, but as the ocean continues to absorb more carbon dioxide, the pH decreases and the ocean becomes more acidic.
NOAA estimates of future carbon dioxide levels, based on business-as-usual emission scenarios, indicate that by the year 2100, the surface waters of the ocean could have a pH of around 7.8. The last time the ocean pH was this low was 14-17 million years ago.
Increasing acidity will make it harder for corals to build skeletons and for shellfish to build the shells they need for protection. Corals are particularly important because they provide homes to many other sea creatures.

A Pakistani man cools off at a river during a heatwave on the outskirts of Islamabad on June 22, 2015.
7. Rising humidity
If you lived in the 1990s you should have noted that it has become more humid, meaning there is more water vapour in the air that makes you feel stickier in hot weather. The change anomaly in humidity rose from -0.2 in 1970 to 0.2 in 2010. Water vapour itself is an important part of the water cycle, and it contributes to the earth’s natural greenhouse effect.