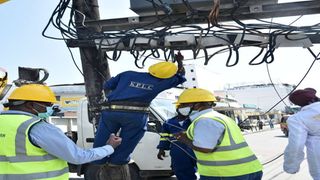
Kenya Power employees carry out repairs on a transformer.
| File | Nation Media GroupBusiness
Premium
Nairobi homes that use more power than several counties combined
What you need to know:
- Nairobi’s huge power demand is also driven by the location of industrial customers.
Homes in Nairobi North comprising Loresho, Westlands and Buruburu came second in demand for electricity in the domestic category consuming 408GWH compared to Nairobi West’s 443GWh.
Households in Nairobi West comprising Lang’ata, Ngong road, Kilimani, Hurlingham and South C consume more electricity than the entire western Kenya, North Rift and Mount Kenya combined.
Kenya Power data also shows these homes have higher demand for electricity than what those in Central Rift, comprising Nakuru, Kericho, Bomet as well as those in the western region comprising towns such as Kisumu, Siaya, Vihiga, Kakamega, Bungoma and Busia use in a year.

Matatus wait for commuters at Buruburu Estate in Nairobi.The estate consumes 408GWH electricity in the domestic category.
The regions have far many more customers than other city estates, underlining the higher consumption per customer for Nairobi households with the overall client base for Mt Kenya, North Rift and Western Kenya more than twice that of Nairobi West.
The data underscores significance of the country’s capital in the consumption of electricity and in driving up demand for power with the city and its environs accounting for close to half the countrywide electricity sales in the period to June 2019.
Nairobi’s huge power demand is also driven by the location of industrial customers, which are found in the Nairobi South region where the highest power demand was recorded countrywide at 1,719 gigawatt hours.
More customers
Homes in Nairobi North comprising Loresho, Westlands and Buruburu came second in demand for electricity in the domestic category consuming 408GWH compared to Nairobi West’s 443GWh.

A Kenya Power employee inspects a meter box of an apartment in Tassia Estate, Nairobi, on February 27, 2020.
The regions, which are far flung however have more customers. Nairobi West had the biggest jump in demand since 2018 while homes in North Rift recorded the biggest drop in demand partly attributed to shift in customer realignments to different regions during the period according to Kenya Power.
Only western region failed to generate enough funds to support its operations even as its sales numbers improved compared to the previous year.
Kenya Power also says the area experienced decreased revenues from sales after its sugar millers such as Mumias collapsed and others experienced lower production over the period.

A section of Runda Paradise. Runda is one of the city estates that had the highest frequency of power outages.
“Decreased revenues from electricity sales in the western Region were mainly caused by the collapse of large scale agri-based industries, mainly in the sugar sector, operating in the region,” Kenya Power wrote in a statement.
The consumption data also points to areas Kenya Power needs to direct focus in maintaining quality of power supply since previous blackout data had shown that Nairobi North comprising estates such as Roysambu, Runda, Githunguri, Baba Dogo and Kiambu had the highest frequency of power outages.
The Ministry of Energy data covering 2016 and 2020 showed that interruptions in Nairobi North lasted between six and three hours per month, higher than the countrywide range of two to four hours per month.
Electricity reliability
Nairobi West households which happen to be the highest consumers experienced least outages with blackouts lasting as low as under two hours a month and have never gone beyond four hours since 2016.
A 2017 study on electricity reliability in Kenya found that Kenya Power was losing more than Sh2 billion per year from power outages. The study by the University of Massachusetts said most outages were caused by faults with just a few being planned by Kenya Power.
“Though planned outages only account for 0.5 percent of total incidences, they account for 5.6 percent of total revenue loss. Limiting the number of planned outages by grouping together maintenance activities whenever possible can help to alleviate some of this revenue loss,” recommended the 2016 study on Kenya’s grid.


